Understanding the Impact of each channel
Rockerbox unlocks the ability to understand the impact and role of each channel in driving users to convert across your digital and offline channels.
Through leveraging Rockerbox you can identify not only the direct impact each channel has in driving users down the funnel but also the bleed impact on other channels. This is particularly relevant for upper funnel/branding focused channels including OTT, Linear TV, Podcasts, and streaming radio.
Priority Questions to Answer
- What is the impact of an individual channel?
- What is the contribution of this channel in driving conversions?
- What is the direct and bleed impact on other channels?
Impact of each channel
Rockerbox captures the full path to conversion for each conversion, identifying every touchpoint in the user journey.
This enables you to understand the impact of each touchpoint across digital and offline channels and in aggregate, you are able to understand the overall contribution of each channel in driving users to convert.
Use Case | Understand the impact of individual channel |
What You Need to See |
|
UI View to Utilize | Customer Paths (Middle notebook icon) |
Report to Utilize | Buckets Breakdown report - find schema and definitions here |
1. Percent of conversions by channel and channel reach
- Utilize the Attribution Report UI view of Buckets Breakdown report
- Utilize % of conversions field to see break out of conversions by channel
Use a Google Data Sync reporting template to automatically report on per-channel performance and conversion distribution by channel
2. Percent of Conversions with one channel as a touchpoint
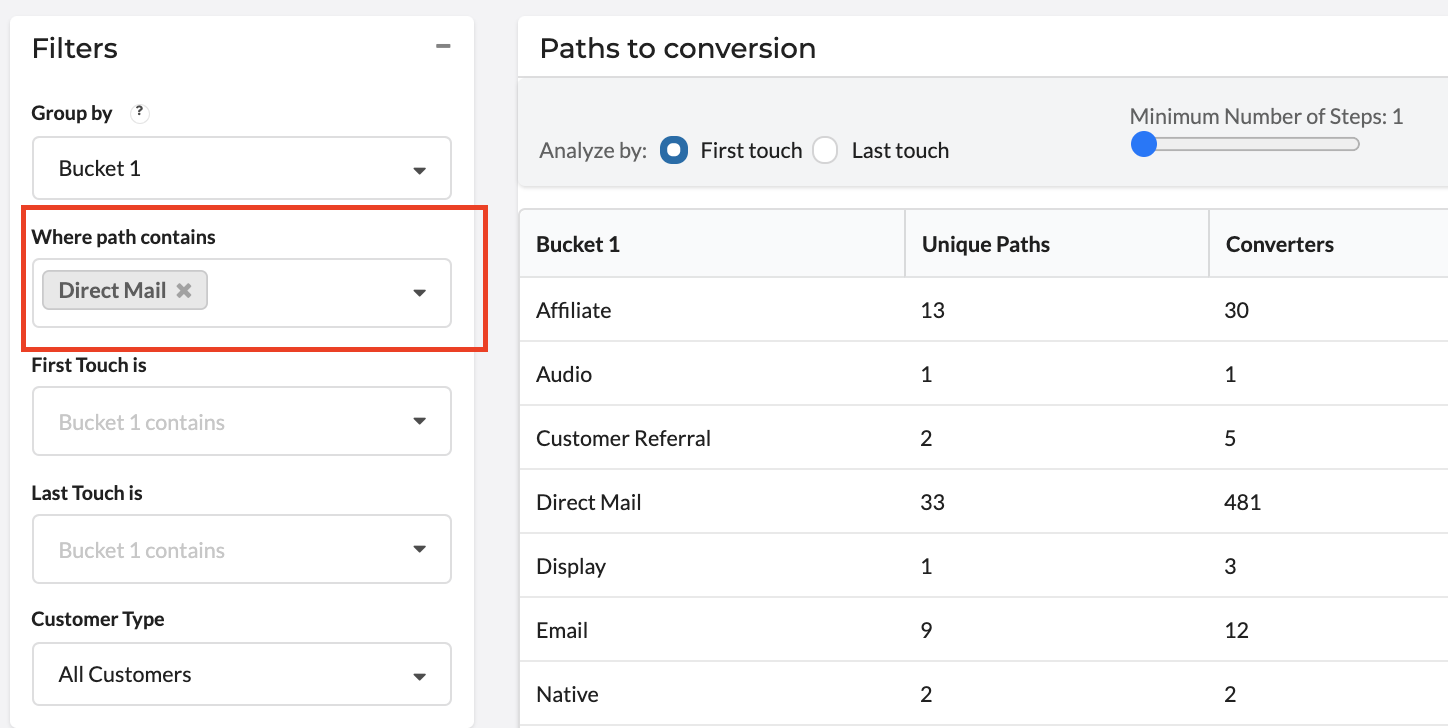
- Go to Customer Paths UI view
- Select the middle icon on the upper left (notebook icon)

- Add a filter for the channel you would like to look at under “Where path contains”

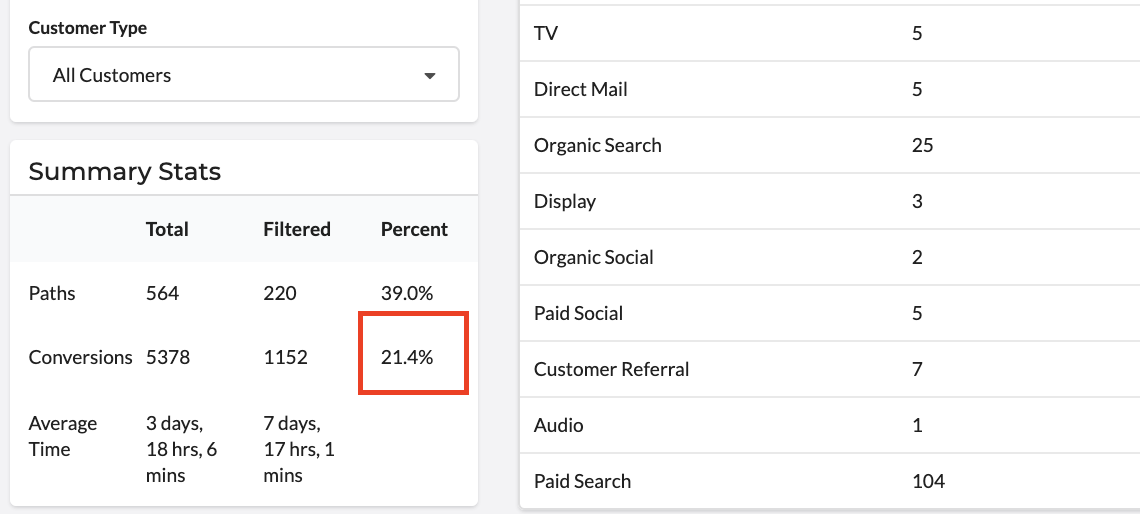
- Use Summary stats in the lower-left corner to identify what percentage of conversions had that channel as a touchpoint in their path to conversion
