Measuring Channel Heavy-ups (Increased spend) & Resulting impact to CPA/ROAS (Diminishing returns)
Rockerbox can be leveraged during your sale periods and channel heavy-ups to understand how your marketing performance and user behavior varied during this time period.
Below we outline the following four analyses:
3. Impact to Top and Bottom funnel channels
4. Impact to Path to Conversion and Time to Convert
Priority Questions to Answer
Marketing Performance
- Impact to CPA- how did CPA change due to heavy discounting coupled with increased spend (and mitigating against diminishing returns)
- Impact of discounting- if you used different discounts across channels, did that change the improvement of CPA of each channel?
User Behavior
- Changes to the path to conversion- were users taking more vs less time to convert and interacting with different marketing touchpoints?
- Impact to your marketing mix- were users converting from different channels?
- Did branding heavy up result in users entering the funnel from different channels (first touch) vs converting from different channels (last touch)?
Choosing a control period
Before you begin any analysis you need to first choose your control period. This is the time period you will compare performance during the sales/heavy-up period against. When choosing your control period consider the following: - Choosing a time period without any significant changes to your marketing mix ( heavy-ups, new channel launched) - For sales with a longer ramp time (i.e. BFCM) - you may want to choose two control time periods (one pre-marketing heavy up and one during heavy up)
Before you begin any analysis you need to first choose your control period. This is the time period you will compare performance during the sales/heavy-up period against. When choosing your control period consider the following: - Choosing a time period without any significant changes to your marketing mix ( heavy-ups, new channel launched) - For sales with a longer ramp time (i.e. BFCM) - you may want to choose two control time periods (one pre-marketing heavy up and one during heavy up)
1. Impact to CPA/ROAS
Priority Questions to answer:
- Impact to CPA/ROAS- how did CPA/ROAS change due to heavy discounting coupled with increased spend (and mitigating against diminishing returns)
- Impact of discounting- if you used different discounts across channels, did that change the improvement on CPA/ROAS of each channel?
Methodology:
- Use our time period comparison feature to compare de-duplicated CPA/ROAS by channel for both the control time period and the sale/heavy-up period.
Resulting Metrics:
- % change in CPA/ROAS by channel
- % change in CPA/ROAS relative to % change in spend
2. Impact to Channel Mix
Priority Questions to Answer
- What was the impact to your marketing mix- were users converting from different channels?
Methodology:
- Use the funnel position view to identify your marketing mix at each stage of the funnel - and how this changes during BFCM
- Identify any changes at the channel level
See here for more details on how to leverage this view
Resulting Metrics:
- % of conversions by channel
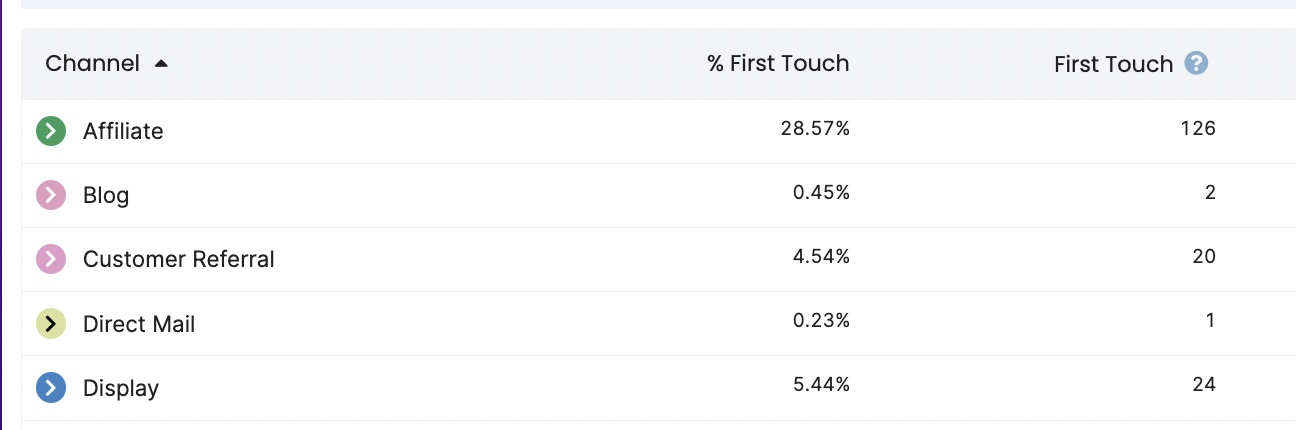
3. Impact to Top and Bottom funnel channels
Priority Questions to Answer:
- Did branding heavy up result in users entering the funnel from different channels (first touch) vs converting from different channels (last touch)?
Methodology:
- Using the marketing paths view to see conversions by first vs last touchpoint
Resulting Metrics:
- % of conversions by channel for last touch vs first touch
- % change in first-touch conversions relative to % change in spend
4. Impact to Path to Conversion and Time to Convert
Priority Questions to Answer:
- How did our users’ path to conversion change- were users taking more vs less time to convert and interacting with different marketing touchpoints.
Methodology:
- Use the marketing paths view to see the average time to conversion and look at any changes * Be sure to filter for new vs existing customers
Resulting Metrics:
- Avg # of days to convert
- Avg # of marketing touchpoints