Data Warehousing Query Library

Rockerbox customers leverage Rockerbox's shared tables in their data warehouse to build custom dashboards against specific use cases.
Contents
- Log Level MTA and Conversions
- Buckets Breakdown and Conversions
- Conversions and (Shopify) order tables
- Marketing Performance
- Time Period Comparison
- Media Pacing
- To Report on Revenue, Spend, CPA & ROAS
- Customer Life Time Value
- Customer Life Time Value (QoQ)
- Customer Life Time Value Q1, Q2, Q3 after first purchase
- Attributed Sessions
- Monitoring Site Traffic and Events over time
Marketing Report Sample Queries
Cross-Channel Attribution report
This SQL query replicates the Cross-Channel Attribution report. This shows for a given time frame, all marketing spend and conversions mapped back to each marketing placement. This report enables you to see weighted CPA/ROAS against marketing placements for new and existing users.
To use this query:
- Input the date range you want to report on - To do this change "Start date YYYY-MM-DD" and "End date YYYY-MM-DD" into your intended report date range and replace with date ranges in for the form of 'YYYY-MM-DD' eg: '2024-01-01'. Dont forget the single quotation marks
- Input your database and table names. - To do this replace each instance of "database name"."buckets breakdown table" with your Rockerbox database name and Bucket Breakdown table name.
- Select the reporting tiers you want to analyze - This is done by uncommenting the 2 thru 5 reporting tiers in two places in the query (one at the towards the top and one at the bottom).
Next hit run and your Cross-Channel Attribution report will be output.
-- CROSS CHANNEL ATTRIBUTION REPORT
WITH date_range AS (
    -- 1. INPUT DATE RANGE
    SELECT
        "Start date YYYY-MM-DD" AS start_date,
        "End date YYYY-MM-DD" AS end_date
),
totals AS (
    SELECT
        SUM(even) AS conversion_count,
        SUM(revenue_even) AS revenue_count,
        SUM(ntf_even) AS ntf_conversion_count,
        SUM(ntf_revenue_even) AS ntf_revenue_count
    FROM
        "database name"."buckets breakdown table"
    WHERE
        date BETWEEN (SELECT start_date from date_range) AND (SELECT end_date from date_range)
)
SELECT
    --- 3.A SELECT REPORTING TIERS
    tier_1 AS RBX_tier_1,
    -- tier_2 AS RBX_tier_2,
    -- tier_3 AS RBX_tier_3,
    -- tier_4 AS RBX_tier_4,
    -- tier_5 AS RBX_tier_5,

    -- ALL CUSTOMERS
    SUM(last_touch) AS conversions_last_touch,
    SUM(first_touch) AS conversions_first_touch,
    SUM(even) AS conversions_even,
    SUM(normalized) AS conversions_normalized,
    SUM(revenue_last_touch) AS revenue_last_touch,
    SUM(revenue_first_touch) AS revenue_first_touch,
    SUM(revenue_even) AS revenue_even,
    SUM(revenue_normalized) AS revenue_normalized,
    SUM(last_touch) * 100.0 / NULLIF((SELECT conversion_count FROM totals), 0) AS percentage_conversions_last_touch,
    SUM(first_touch) * 100.0 / NULLIF((SELECT conversion_count FROM totals), 0) AS percentage_conversions_first_touch,
    SUM(even) * 100.0 / NULLIF((SELECT conversion_count FROM totals), 0) AS percentage_conversions_even,
    SUM(normalized) * 100.0 / NULLIF((SELECT conversion_count FROM totals), 0) AS percentage_conversions_normalized,
    SUM(revenue_last_touch) * 100.0 / NULLIF((SELECT revenue_count FROM totals), 0) AS percentage_revenue_last_touch,
    SUM(revenue_first_touch) * 100.0 / NULLIF((SELECT revenue_count FROM totals), 0) AS percentage_revenue_first_touch,
    SUM(revenue_even) * 100.0 / NULLIF((SELECT revenue_count FROM totals), 0) AS percentage_revenue_even,
    SUM(revenue_normalized) * 100.0 / NULLIF((SELECT revenue_count FROM totals), 0) AS percentage_revenue_normalized,

    -- NEW CUSTOMERS ONLY
    SUM(ntf_last_touch) AS ntf_conversions_last_touch,
    SUM(ntf_first_touch) AS ntf_conversions_first_touch,
    SUM(ntf_even) AS ntf_conversions_even,
    SUM(ntf_normalized) AS ntf_conversions_normalized,
    SUM(ntf_revenue_last_touch) AS ntf_revenue_last_touch,
    SUM(ntf_revenue_first_touch) AS ntf_revenue_first_touch,
    SUM(ntf_revenue_even) AS ntf_revenue_even,
    SUM(ntf_revenue_normalized) AS ntf_revenue_normalized,
    SUM(ntf_last_touch) * 100.0 / NULLIF((SELECT ntf_conversion_count FROM totals), 0) AS ntf_percentage_conversions_last_touch,
    SUM(ntf_first_touch) * 100.0 / NULLIF((SELECT ntf_conversion_count FROM totals), 0) AS ntf_percentage_conversions_first_touch,
    SUM(ntf_even) * 100.0 / NULLIF((SELECT ntf_conversion_count FROM totals), 0) AS ntf_percentage_conversions_even,
    SUM(ntf_normalized) * 100.0 / NULLIF((SELECT ntf_conversion_count FROM totals), 0) AS ntf_percentage_conversions_normalized,
    SUM(ntf_last_touch) * 100.0 / NULLIF((SELECT ntf_revenue_count FROM totals), 0) AS ntf_percentage_revenue_last_touch,
    SUM(ntf_first_touch) * 100.0 / NULLIF((SELECT ntf_revenue_count FROM totals), 0) AS ntf_percentage_revenue_first_touch,
    SUM(ntf_even) * 100.0 / NULLIF((SELECT ntf_revenue_count FROM totals), 0) AS ntf_percentage_revenue_even,
    SUM(ntf_normalized) * 100.0 / NULLIF((SELECT ntf_revenue_count FROM totals), 0) AS ntf_percentage_revenue_normalized,

    -- TOTAL SPEND
    SUM(spend) AS spend,

    -- ROAS
    SUM(revenue_last_touch) / NULLIF(SUM(spend), 0) AS roas_last_touch,
    SUM(revenue_first_touch) / NULLIF(SUM(spend), 0) AS roas_first_touch,
    SUM(revenue_even) / NULLIF(SUM(spend), 0) AS roas_even,
    SUM(revenue_normalized) / NULLIF(SUM(spend), 0) AS roas_normalized,

    -- CPA
    SUM(last_touch) / NULLIF(SUM(spend), 0) AS cpa_last_touch,
    SUM(first_touch) / NULLIF(SUM(spend), 0) AS cpa_first_touch,
    SUM(even) / NULLIF(SUM(spend), 0) AS cpa_even,
    SUM(normalized) / NULLIF(SUM(spend), 0) AS cpa_normalized

FROM
    "database name"."buckets breakdown table",
    date_range
WHERE
    date BETWEEN date_range.start_date AND date_range.end_date
GROUP BY
    --- 3.A SELECT REPORTING TIERS
    tier_1
    -- tier_2,
    -- tier_3,
    -- tier_4,
    -- tier_5;
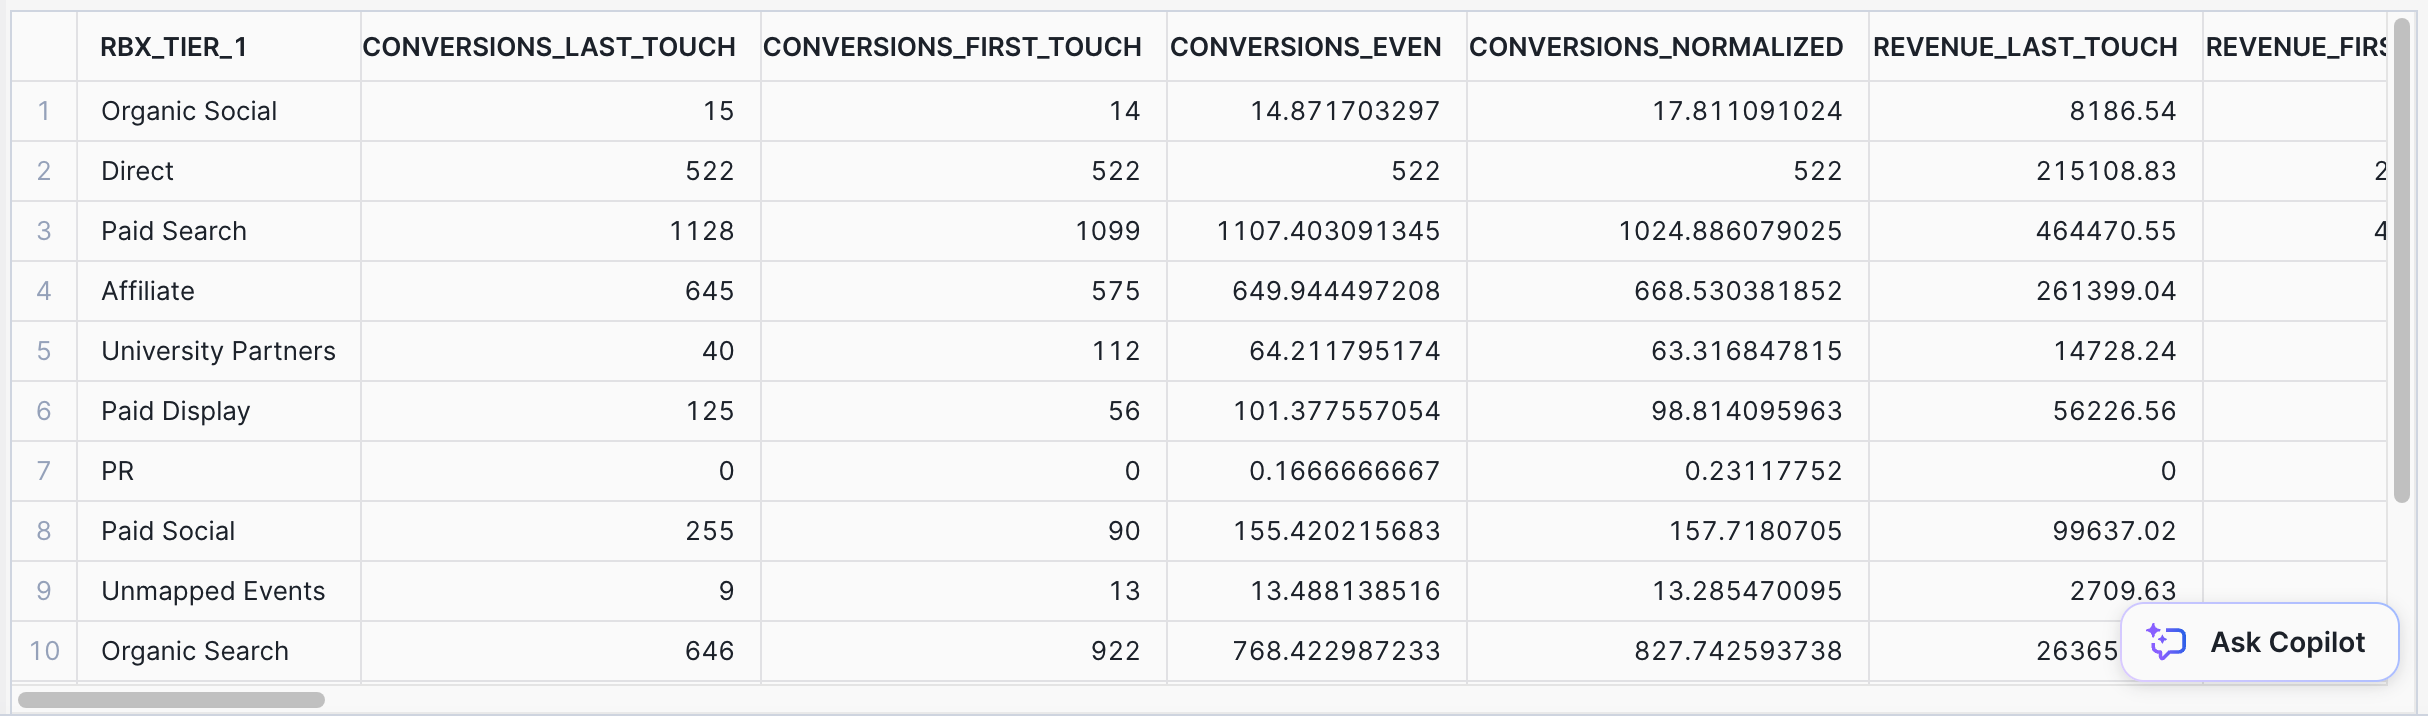
Example results from the Cross-Channel Attribution report in Snowflake
Time Period Comparison (Compare performance across key time frames (ex MoM, WoW, QoQ, YoY) to assess trending changes in performance or spend)
SET DEFAULT ROLE TO CS;
USE ROLE CS;
USE WAREHOUSE CS;

-- WEEK OVER WEEK TIME PERIOD COMPARISON
SELECT
 WEEK1.DATE AS TP1_DATE
 , WEEK1.CONVERSIONS AS TP1_CONVERSIONS
 , WEEK2.DATE AS TP2_DATE
 , WEEK2.CONVERSIONS AS TP2_CONVERSIONS
 , (WEEK2.CONVERSIONS - WEEK1.CONVERSIONS)/ WEEK1.CONVERSIONS * 100 AS TP1_TP2_CONVERSIONS_DETLA
 , WEEK1.REVENUE AS TP1_REVENUE
 , WEEK2.REVENUE AS TP2_REVENUE
 , (WEEK2.REVENUE - WEEK1.REVENUE)/ WEEK1.REVENUE * 100 AS TP1_TP2_REVENUE_DETLA
FROM (
 -- TIME PERIOD 1
 SELECT
 DATE
 , DAYOFWEEK(DATE) AS DAYOFWEEK
 , SUM(NORMALIZED) AS CONVERSIONS
 , SUM(REVENUE_NORMALIZED) AS REVENUE
 FROM [Customer name].PUBLIC.[Log level MTA]
 WHERE (DATE >= '2023-11-27' AND DATE <= '2023-12-03')
 GROUP BY DATE
 ORDER BY DATE
) AS WEEK1
JOIN (
 -- TIME PERIOD 2
 SELECT
 DATE
 , DAYOFWEEK(DATE) AS DAYOFWEEK
 , SUM(NORMALIZED) AS CONVERSIONS
 , SUM(REVENUE_NORMALIZED) AS REVENUE
 FROM [Customer name].PUBLIC.[Log level MTA]
 WHERE (DATE >= '2023-11-20' AND DATE <= '2023-11-26')
 GROUP BY DATE
 ORDER BY DATE
) AS WEEK2
-- JOINED ON DAYOFWEEK
ON WEEK1.DAYOFWEEK = WEEK2.DAYOFWEEKsql
Media Pacing (compare actual spend across channels to planned spend to monitor pacing)
SET DEFAULT ROLE TO CS;
USE ROLE CS;
USE WAREHOUSE CS;
SELECT
BUDGET.DATE_VALUE AS DATE
, BUDGET.PLATFORM_BUDGET_DAILY
, SPEND.SPEND
, SPEND.SPEND - BUDGET.PLATFORM_BUDGET_DAILY AS DELTA_ABS
, (SPEND.SPEND - BUDGET.PLATFORM_BUDGET_DAILY)/ SPEND.SPEND * 100 AS DELTA_PER
FROM (
-- PLANNED SPEND DUMMY DATA
WITH RECURSIVE DATE_RANGE AS (
SELECT '2023-12-01'::DATE AS DATE_VALUE
UNION ALL
SELECT DATE_VALUE + 1
FROM DATE_RANGE
WHERE DATE_VALUE < '2023-12-30'::DATE
)
SELECT DATE_VALUE, 15000 AS PLATFORM_BUDGET_DAILY FROM DATE_RANGE ) AS BUDGET
LEFT JOIN (
SELECT
DATE
, SUM(SPEND) AS SPEND
FROM [Customer name].PUBLIC.FACEBOOK_PLATFORM_DATA
WHERE (DATE >= '2023-12-01' AND DATE <= '2023-12-30')
GROUP BY DATE
ORDER BY DATE
) AS SPEND
ON BUDGET.DATE_VALUE = SPEND.DATE
To Report on Revenue, Spend, CPA & ROAS at Tier 1 Granularity Over a Custom Date Range
--CPA ROAS tier1 across all dates
select
 tier_1,
 NULLIF(SUM(normalized),0) as normalized,
 NULLIF(SUM(revenue_normalized),0) as revenue_normalized,
 NULLIF(SUM(spend),0) as spend,
 NULLIF(SUM(spend),0) / NULLIF(SUM(normalized),0) as CPA,
 SUM(revenue_normalized) / NULLIF(SUM(spend),0) as ROAS,
 NULLIF(SUM(ntf_normalized),0) as ntf_normalized,
 NULLIF(SUM(ntf_revenue_normalized),0) as ntf_revenue_normalized,
 NULLIF(SUM(spend),0) / NULLIF(SUM(ntf_normalized),0) as NTF_CPA,
 SUM(ntf_revenue_normalized) / NULLIF(SUM(spend),0) as NTF_ROAS,
from Buckets_Breakdown_Purchase_Batch
where
 date >= [Enter Start Date]
 and date <= [End End Date]
group by 1
order by 1;
Customer Life Time Value
WITH
-- Define date values
DateParameters AS (
SELECT
CAST('2023-01-01' AS DATE) AS start_date,
CAST('2023-12-31' AS DATE) AS end_date,
),
-- Calculate the Average Order Value
AverageOrderValue AS (
SELECT
AVG(REVENUE) AS average_order_value
FROM
"RB_DATABASE"."RB_CONVERSION_DATA",
DateParameters
WHERE
DATE BETWEEN DateParameters.start_date AND DateParameters.end_date
),
-- Calculate the Average Purchasing Frequency
AveragePurchasingFrequency AS (
SELECT
AVG(purchase_count) AS average_purchasing_frequency
FROM (
SELECT
EMAIL,
COUNT(*) AS purchase_count
FROM
"RB_DATABASE"."RB_CONVERSION_DATA",
DateParameters
WHERE
DATE BETWEEN DateParameters.start_date AND DateParameters.end_date
GROUP BY
) AS customer_purchases
),
-- Calculate the Average Customer Lifetime
AverageCustomerLifetime AS (
SELECT
AVG(customer_lifetime) AS average_customer_lifetime
FROM (
SELECT
EMAIL,
DATEDIFF(month, MIN(DATE), MAX(DATE)) AS customer_lifetime
FROM
"RB_DATABASE"."RB_CONVERSION_DATA",
DateParameters
WHERE
DATE BETWEEN DateParameters.start_date AND DateParameters.end_date
GROUP BY
) AS customer_lifetimes
)
-- Combine results to get Lifetime Value
SELECT
AOV.average_order_value,
APF.average_purchasing_frequency,
ACL.average_customer_lifetime,
(AOV.average_order_value * APF.average_purchasing_frequency * ACL.average_customer_lifetime) AS lifetime_value
FROM
AverageOrderValue AOV,
AveragePurchasingFrequency APF,
AverageCustomerLifetime ACL;
Customer Life Time Value (QoQ)
WITH
-- Calculate the first purchase quarter for each customer
CustomerFirstPurchase AS (
SELECT
EMAIL,
MIN(DATE) AS first_purchase_date,
CONCAT(EXTRACT(YEAR FROM MIN(DATE)), '-Q', EXTRACT(QUARTER FROM MIN(DATE))) AS first_purchase_quarter
FROM
"RB_DATABASE"."RB_CONVERSION_DATA"
GROUP BY
),
-- Calculate the Average Order Value for each quarter
AverageOrderValue AS (
SELECT
CFP.first_purchase_quarter,
AVG(T_CONVERSIONS.REVENUE) AS average_order_value
FROM
"RB_DATABASE"."RB_CONVERSION_DATA" AS T_CONVERSIONS
JOIN CustomerFirstPurchase CFP ON T_CONVERSIONS.EMAIL = CFP.EMAIL
WHERE
CFP.first_purchase_date = T_CONVERSIONS.DATE
GROUP BY
CFP.first_purchase_quarter
),
-- Calculate the Average Purchasing Frequency
AveragePurchasingFrequency AS (
SELECT
customer_purchases.first_purchase_quarter,
AVG(purchase_count) AS average_purchasing_frequency
FROM (
SELECT
CFP.EMAIL,
CFP.first_purchase_quarter,
COUNT(*) AS purchase_count
FROM
"RB_DATABASE"."RB_CONVERSION_DATA" AS T_CONVERSIONS
JOIN CustomerFirstPurchase CFP ON T_CONVERSIONS.EMAIL = CFP.EMAIL
GROUP BY
CFP.EMAIL, CFP.first_purchase_quarter
) AS customer_purchases
GROUP BY
first_purchase_quarter
),
-- Calculate the Average Customer Lifetime
AverageCustomerLifetime AS (
SELECT
first_purchase_quarter,
AVG(customer_lifetime) AS average_customer_lifetime
FROM (
SELECT
CFP.EMAIL,
first_purchase_quarter,
DATEDIFF(month, MIN(DATE), MAX(DATE)) AS customer_lifetime
FROM
"RB_DATABASE"."RB_CONVERSION_DATA" AS T_CONVERSIONS
JOIN CustomerFirstPurchase CFP ON T_CONVERSIONS.EMAIL = CFP.EMAIL
GROUP BY
CFP.EMAIL, CFP.first_purchase_quarter
) AS customer_lifetimes
GROUP BY
first_purchase_quarter
)
-- Combine results to get Lifetime Value
SELECT
AOV.first_purchase_quarter,
AOV.average_order_value,
APF.average_purchasing_frequency,
ACL.average_customer_lifetime,
(AOV.average_order_value * APF.average_purchasing_frequency * ACL.average_customer_lifetime) AS lifetime_value
FROM
AverageOrderValue AOV
JOIN AveragePurchasingFrequency APF ON AOV.first_purchase_quarter = APF.first_purchase_quarter
JOIN AverageCustomerLifetime ACL ON AOV.first_purchase_quarter = ACL.first_purchase_quarter
ORDER BY
first_purchase_quarter
Customer Life Time Value Q1, Q2, Q3 after first purchase
WITH
CustomerFirstPurchase AS (
SELECT
EMAIL,
MIN(DATE) AS first_purchase_date,
CONCAT(EXTRACT(YEAR FROM MIN(DATE)), '-Q', EXTRACT(QUARTER FROM MIN(DATE))) AS first_purchase_quarter
FROM
"RB_DATABASE"."RB_CONVERSION_DATA"
GROUP BY
),
RevenueByPeriod AS (
SELECT
CFP.EMAIL,
CFP.first_purchase_quarter,
SUM(CASE
WHEN DATEDIFF(day, CFP.first_purchase_date, T_CONVERSIONS.DATE) = 0
THEN T_CONVERSIONS.REVENUE
ELSE 0
END) AS first_purchase_revenue,
SUM(CASE
WHEN DATEDIFF(day, CFP.first_purchase_date, T_CONVERSIONS.DATE) <= 90
THEN T_CONVERSIONS.REVENUE
ELSE 0
END) AS three_month_revenue,
SUM(CASE
WHEN DATEDIFF(day, CFP.first_purchase_date, T_CONVERSIONS.DATE) <= 180
THEN T_CONVERSIONS.REVENUE
ELSE 0
END) AS six_month_revenue,
SUM(CASE
WHEN DATEDIFF(day, CFP.first_purchase_date, T_CONVERSIONS.DATE) <= 270
THEN T_CONVERSIONS.REVENUE
ELSE 0
END) AS nine_month_revenue
FROM
"RB_DATABASE"."RB_CONVERSION_DATA"Customer Life Time Value Q1, Q2, Q3 after first purchase AS T_CONVERSIONS
JOIN CustomerFirstPurchase CFP ON T_CONVERSIONS.EMAIL = CFP.EMAIL
GROUP BY
CFP.EMAIL, CFP.first_purchase_quarter
),
AverageRevenuePerCustomer AS (
SELECT
first_purchase_quarter,
AVG(first_purchase_revenue) AS avg_first_purchase_revenue,
AVG(three_month_revenue) AS avg_three_month_revenue,
AVG(six_month_revenue) AS avg_six_month_revenue,
AVG(nine_month_revenue) AS avg_nine_month_revenue
FROM
RevenueByPeriod
GROUP BY
first_purchase_quarter
)
SELECT
first_purchase_quarter,
avg_first_purchase_revenue,
avg_three_month_revenue,
avg_six_month_revenue,
avg_nine_month_revenue
FROM
AverageRevenuePerCustomer
ORDER BY
first_purchase_quarter
Attributed Sessions
The count of unique sessions attributed to click-based marketing touchpoints.
SELECT
    SUM(session_start) AS session_count,
    date,
    tier_1,
    tier_2,
    tier_3,
    tier_4,
    tier_5
FROM `database.schema.table`
WHERE
     date BETWEEN 'YYYY-MM-DD' AND 'YYYY-MM-DD'
     AND session_start = 1
GROUP BY date, tier_1, tier_2, tier_3, tier_4, tier_5;
Monitoring Site Traffic and Events over time
SELECT
    date,
    COUNT(DISTINCT uid) AS users,
    SUM(CASE WHEN session_start = '1' THEN 1 ELSE 0 END) AS sessions,
    COUNT(*) AS event_count
FROM `database.schema.table`
WHERE
    AND date BETWEEN 'YYYY-MM-DD' AND 'YYYY-MM-DD'
GROUP BY
    date
ORDER BY
    date;