Getting started with Rockerbox Data Warehousing
Getting started with Rockerbox Data Warehousing can seem like a big task, here are your first few steps
Questions to Answer
- How do I get set up with Rockerbox Data Warehousing?
- How do I write my first query?
- What data is in the tables?
- How do I join log level MTA and the Conversions data?
- How do I build a dashboard in Looker or Tableau?
- How do I perform advanced analysis?
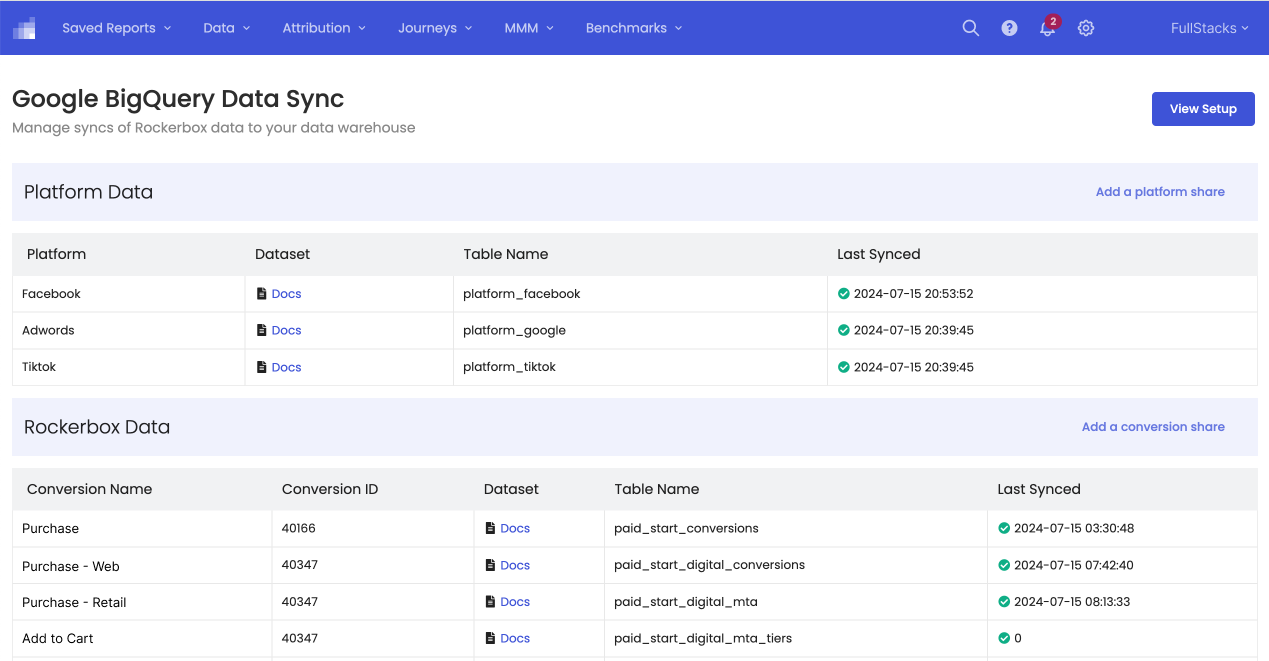
How do I get set up with Rockerbox Data Warehousing?
- Check the Data Warehousing Sync page in the Rockerbox platform
- If it says "Contact Sales to get access to Export" then you need to speak to your Customer Success Manager to get Data Warehousing added to your contract and enabled.
- If it says Snowflake, Google BigQuery or Amazon Redshift Data Sync then you are ready
- Open your Data Warehouse terminal in either Snowflake, Google BigQuery or Amazon Redshift. These may all look different and you'll need to speak to your internal data team to get access
- If you're using a model database query Graphic User Interface (GUI), you should see the following:
- the name of the database
- a list of tables
- somewhere to write your query
- somewhere to see your results
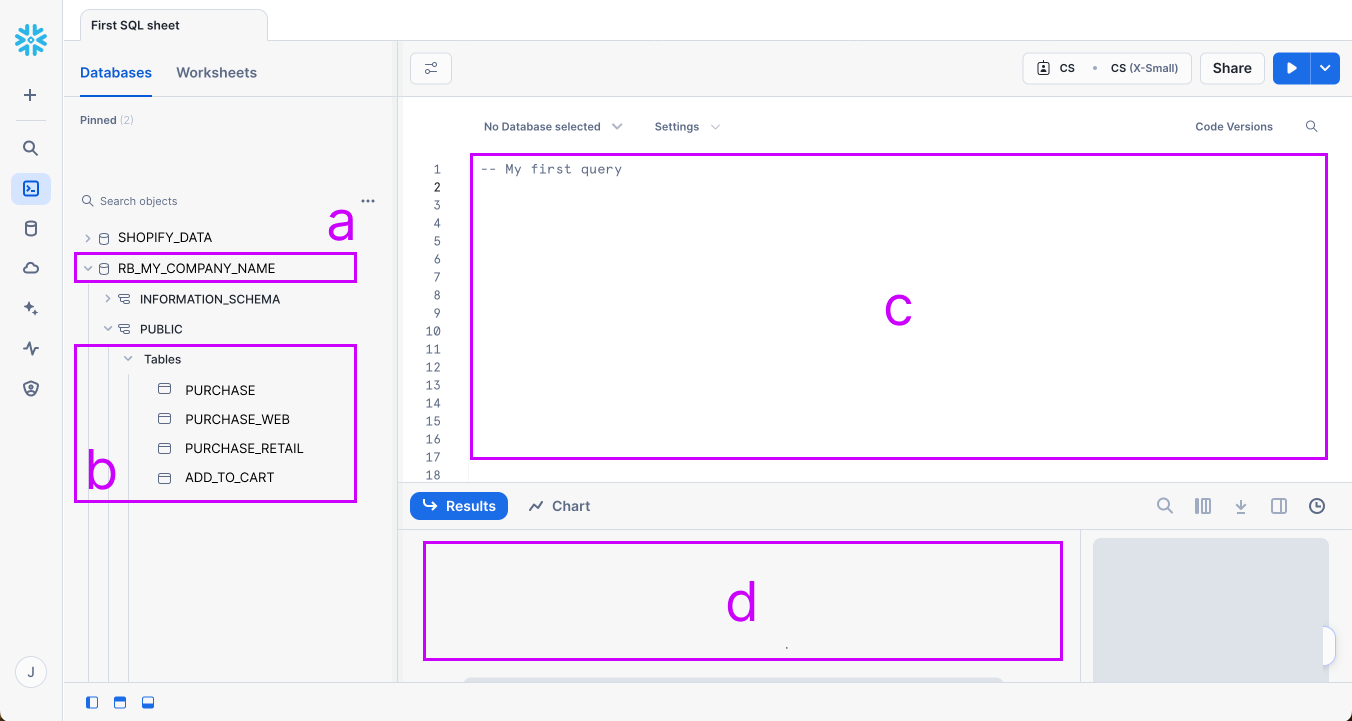
With that confirmed, you're ready to write your first query.
How do I write my first query?
- Select and type the below
SELECT TOP 10 * FROM DATABASE_NAME.TABLE_NAME
- Replace DATABASE_NAME with the name of your database, this is usually RB_your company name
- Replace TABLE_NAME with the name of one of your tables (pick ant from 3.b. above if you're unsure)
- Hit Run and wait for your data to populate
Great job, you've run your first query using Rockberbox data.
What data is in the tables?
- Rockerbox tables
- Buckets Breakdown
This is a count of conversions, revenue and spend per day for marketing activity as per your 1 to 5 performance reporting tiers. Conversions and revenue is provided by first, last, event and MTA (normalized) attrbiution model and its available for all and just new customers (columns prefixed with ntf_). - Log Level MTA
This is a list of marketing touchpoints associated with your conversions. This table needs to be set up for each of your conversion events that Rockerbox is tracking (such as View Product, Add to Cart and Purchase). It has one entry per marketing touchpoint for each conversion and provides details for that touchpoint such as its 1 to 5 performance reporting tiers, its sequence number, the count of marketing touchpoints before it, its MTA conversion and revenue credit and other details like UTM params and spend key if associated. - Conversions
This is a list of your conversions. This table needs to be set up for each of your conversion events that Rockerbox is tracking (such as View Product, Add to Cart and Purchase). It has one entry per conversion and provides details for each conversion such as date and, if a purchase event, will also contain order number as well as customer information like email, phone number and ID if applicable. All other purchase data is provided though the unstructured additional_attributes field.
- Buckets Breakdown
- Platform tables
- Platform-reported performance pulled and standardized for ease of use. Supported Platforms: Google, Bing, Facebook, TikTok, Snapchat, Pinterest, Linkedin
How do I join log level MTA and the conversions tables?
SELECT *
FROM LOG_LEVEL_MTA_TABLE m
LEFT JOIN CONVERSIONS_TABLE c
    ON m.date = c.date
    AND m.conversion_key = c.conversion_key
;
Converison_key is the join key that relates an entry in the Conversions table with each unique path to conversion in the log level MTA table. There is a many-to-one relationship between the Log Level MTA and Conversions tables. Think “each conversion can have multiple marketing touch points" and each touchpoint in the MTA table receives fractional credit for the given conversion.
Including DATE as a join key produces a more efficient join due to the nature of how Rockerbox shares these datasets with your warehouse. ROckerbox shares the data in external tables which the files are partitioned by date. Including the date allows the warehouse query engine to more efficiently scan only the relevant files needed per the query request.
How do I build a dashboard in Looker or Tableau?
To pull your Rockerbox data into a data visualization or reporting tool - like Looker or Tableau - follow the instructions
- Open your data visualization or reporting tool
- Connect to a new data source
- Select your data warehouse type (eg Snowflake, Redshift or BigQuery)
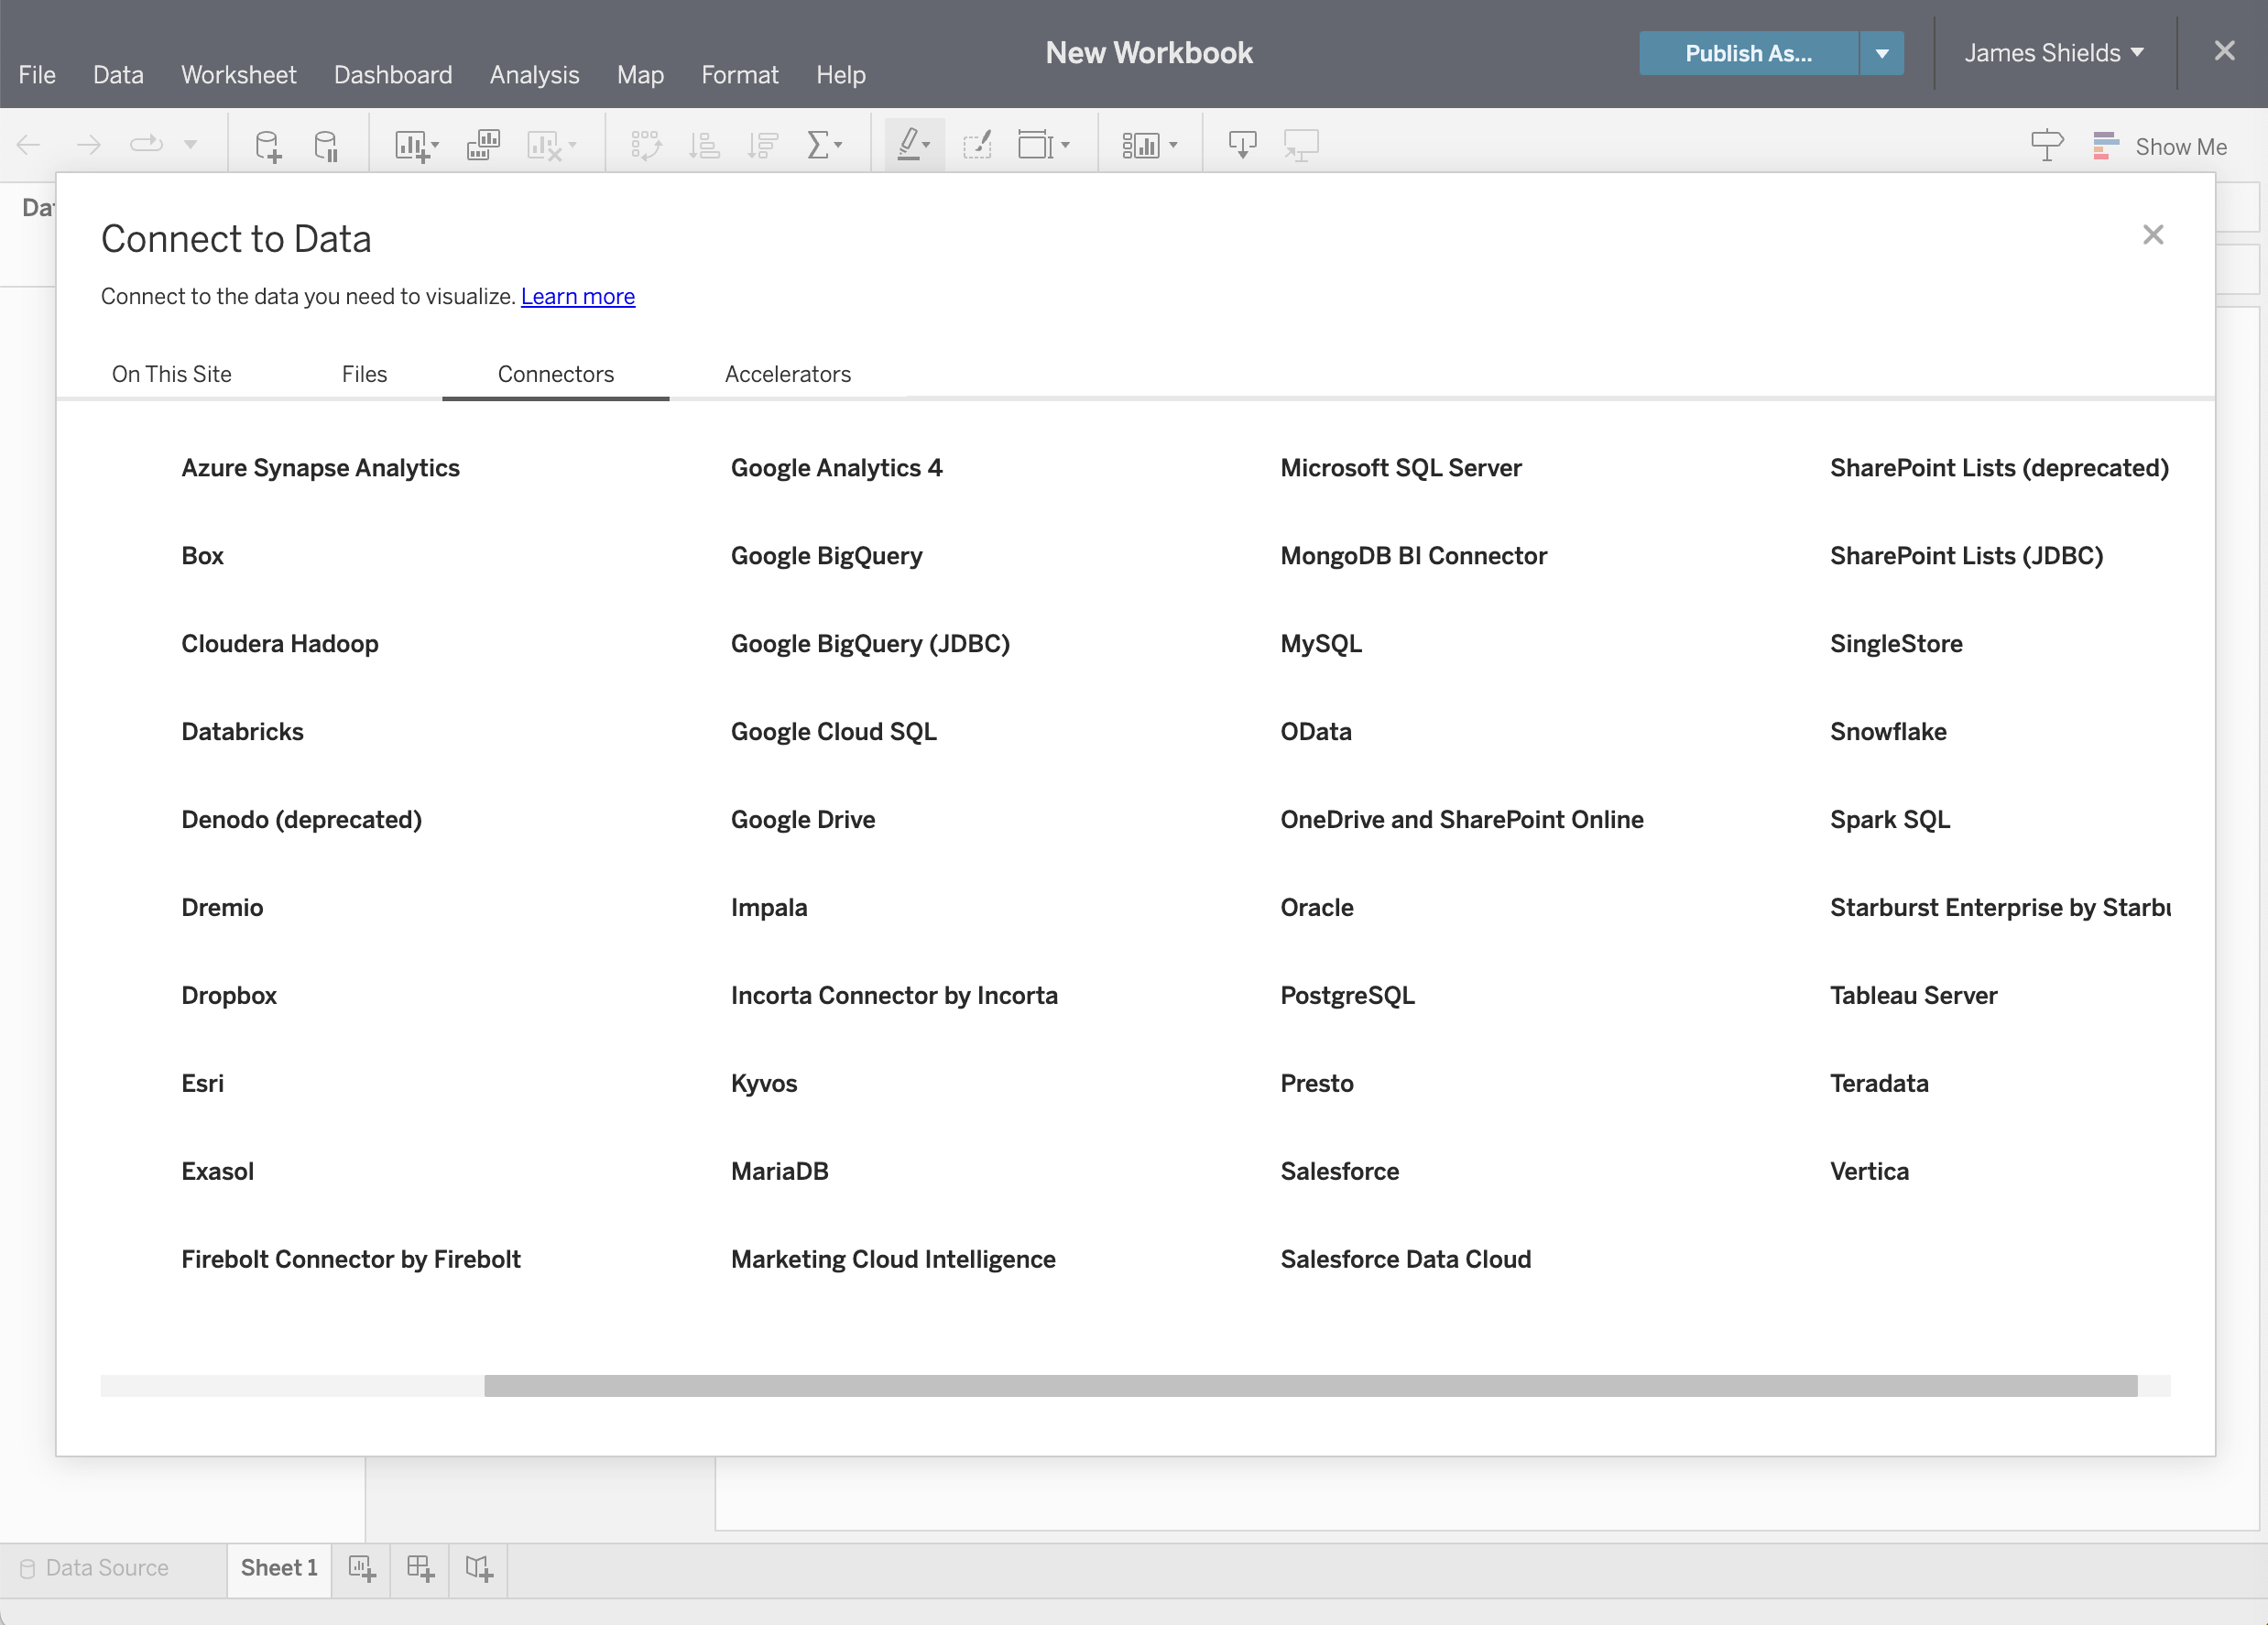
- Follow the instructions to enter your server name, access credentials and select the tables you want to connect
- Some data visualization or reporting tools - like Looker or Tableau - let you define table joins so you can perform analysis across tables. In other tools, you may have to build these as queries in your Data Warehouse terminal.
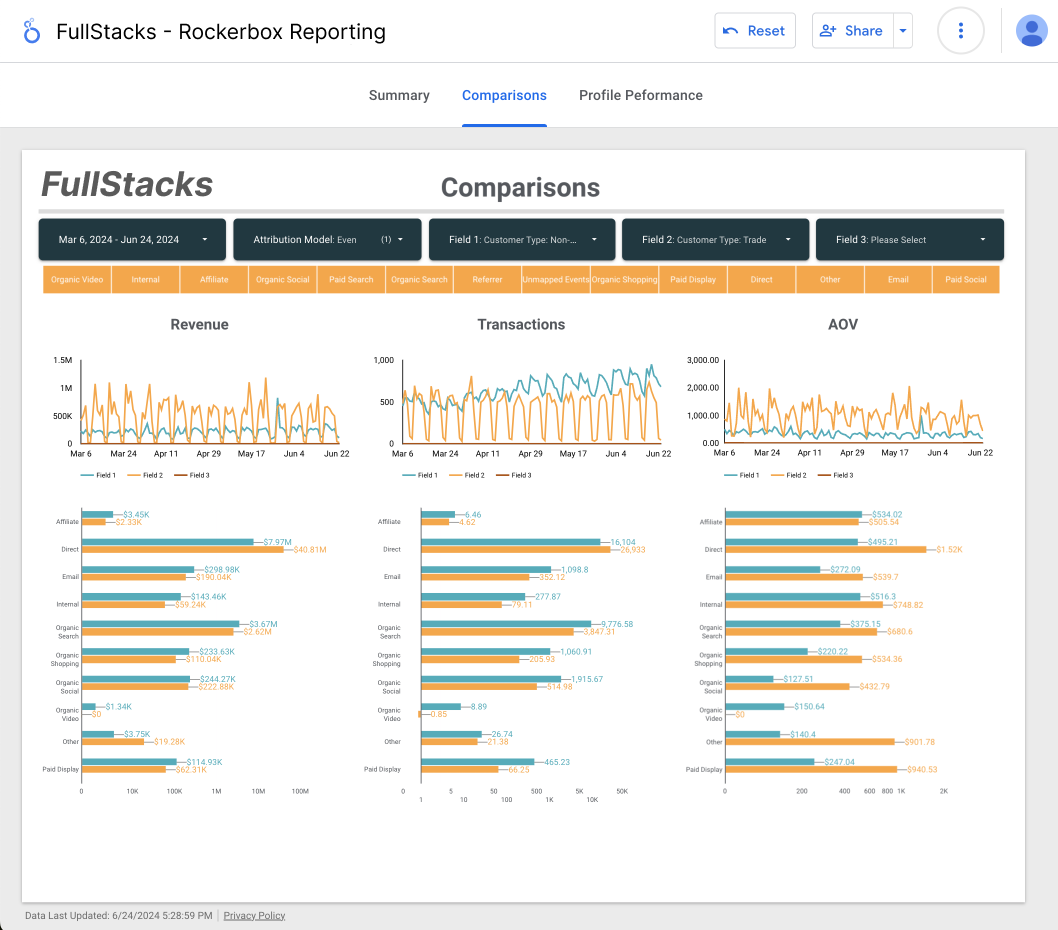
- Once the data is connected, you can build dashboards using all of your Rockerbox data
How do I perform advanced analysis?
Now you're ready to perform advanced analysis with your Rockerbox data
- Check out our Data Warehouse Use Case Resource Library
- Speak to your CSM to discuss a specific use case