Modeling Detailed

Overview
Model definition
Rockerbox builds a logistic model that uses the customers’ Marketing Interactions to establish a likelihood that a customer will complete a given Conversion (eg. Purchase).
Marketing Interactions are the independent variables in our model. They are binary variables that indicate whether a customer has interacted with a specific piece / classification of marketing. Conversions are the dependent variables in our model. They are binary variables that indicate whether a customer successfully completes a Conversion.
Formalizing this a bit more:
- X is a matrix describing our independent variables (Marketing Interactions). It has i rows and j columns, where i is the number of all users Rockerbox has data for and j is the number of Marketing Interactions being evaluated by the model.
- Each row of the matrix is a single customer’s marketing interactions
- Each element within the row indicates whether that customer interacted with a
piece of marketing.
- y is a vector of length i, indicating whether each customer in our model completed a
given conversion event. - f represents our trained logistic model.
- ŷ is predicted probability for each customer from our logistic model. .
The regression’s model with our independent variables can be simply described using the following formula:
f(X) = ŷ
Model Usage
Although the logistic model is designed to be a predictive model, the probability associated with a user’s likelihood to convert is not the result we are after. Rather, we are looking to use the weights of the model to describe the historical behavior of marketing. In this capacity, for each user that has converted, we award credit to a marketing channel based on the normalized weights from our model.Specifically, if a single user interacted with three marketing touchpoints before converting, the conversion would be credited to the relative distribution of the weights associated with those variables from our model.
Data Preparation
Clean data is important for the model to have good descriptive / predictive power. For this model, we have a few techniques to ensure that (1) the number of independent variables trained against are limited and (2) all marketing interaction information is included in the model.
Marketing tiering
All marketing interactions are placed into a hierarchy. We call this process tiering. This tiering allows us to easily classify every marketing touchpoint with an accurate description and group similar marketing touchpoints together.
Limiting variables
A significant reason for tiering variables is so that we can limit the number of independent variables that are ultimately included in the model without losing critical details about marketing interaction. By placing marketing events into tiers, we can easily “roll-up” marketing interactions from a lower tier to a higher tier, if there is a lack of sufficient data to support a variable being included in the model as its own marketing touch point.
An example of this rollup would be a marketing campaign that is testing hundreds of different personalized variations of a creative. Although no individual creative produces enough marketing to be included in the model on its own, the campaign can encompass all of these sub-strategies, be included in the model and correctly assign credit to this set of marketing interactions.
We try to limit the number of variables in the model based on the number of conversions we see per day. We dynamically set the minimum threshold a variable would need to be included in the model to ratio to avoid overfitting.
Variable correlations
Outside of tiering the data and automatically limiting which tiers get included in the model based on threshold, we also can remove variables that are highly correlated with one another. This is currently still a manual pruning process that we perform if it is an issue for a set of independent variables.
Cohort / data selection
The users that are selected to be part of the model are chosen to ensure that a sufficient attribution window is present for all marketing interactions to have an impact on a user converting. An analysis is run for the conversion event against which we are building the model to determine the cohort window. Specifically, we are looking to set a cohort window to capture 95% of the events that interacted with users that converted.
After we know the conversion window necessary to build a model, we select cohorts to be included in our model using the following procedure:
For dates < (today - cohort_window), find all users whose first interaction occurred on a particular day. Then, select all marketing interactions going forward from this day through the end of the cohort window.
The below diagram that shows the cohort selection criteria for a cohort window of 30 days:
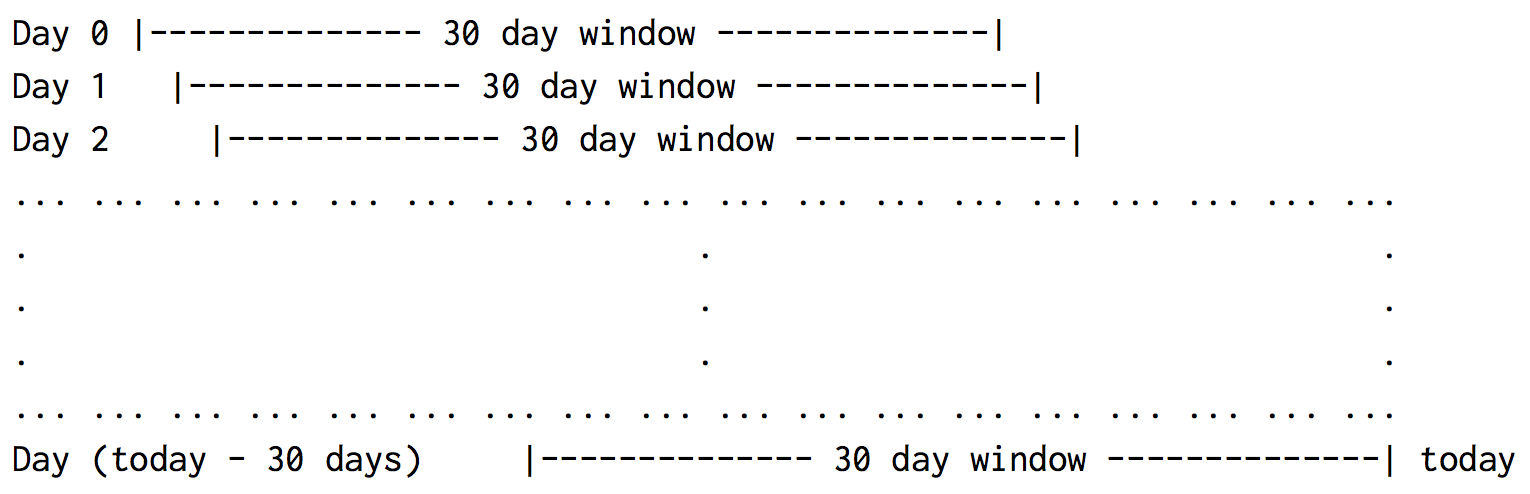
Using the above data selection enables us to have a complete and fair dataset against which to properly evaluate and assign weight.
Modeling Technique
With the above tiering and data selection complete, we are ready to build the model. To do this, we break up model building into two parts.
- First, we dynamically determine a C value to penalize over-fitting.
- Next, we train the model and evaluate the results.
In both of the above two steps, we use stratified k-folds. To determine the C value, we use a grid search across all k-folds to determine the best value.
To test, train and evaluate the model, we again use cross-validation folds to run multiple datasets through test and train to produce the evaluation metrics and plots used to evaluate the model.