TV Lift Analysis

[block:html]
{
  "html": "\n\n"
}
[/block]
Lift Analysis
Below is the criteria that Rockerbox uses to determine if a commercial had a statistically significant influence on a conversion (website visit) and if a synthetic event needs to be included in the user’s path to conversion.
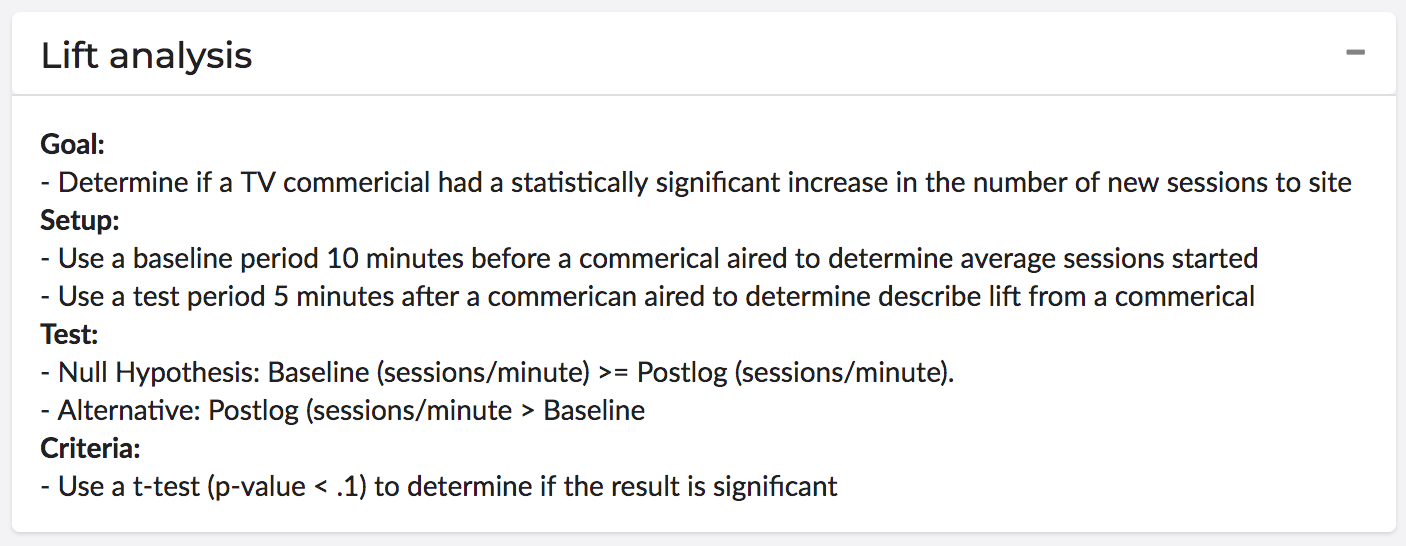
If there’s no baseline traffic for any given spot—in other words, if we didn’t measure any new sessions from the defined geography in the time window leading to the spot—that spot will not appear in this view.
Postlog Analysis
The bar chart below illustrates the number of TV commercials aired on any given date. Pro-tip: hover over the chart to see the exact number of commercials.
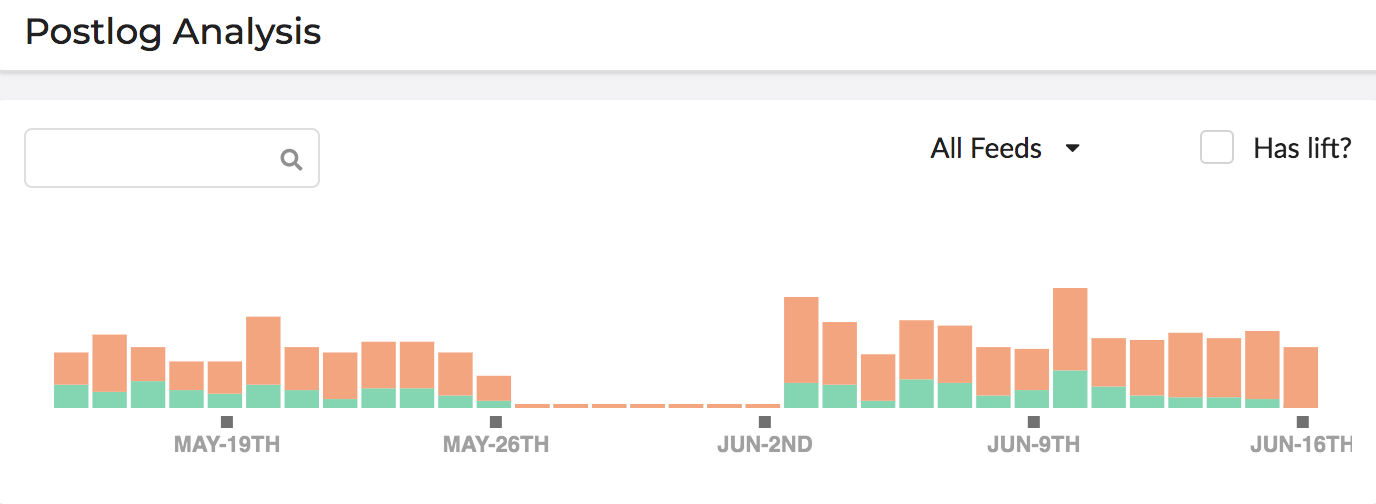
This view displays spots that have sessions both before and after the ad spot. If an ad spot only had sessions prior to the ad, after the ad, or neither, then it will not appear in this view.
In the top right corner, you’ll notice a dropdown with “All Feeds” and a filter that reads “Has lift?”
The dropdown will allow you to select from All Feeds, Dual Feed, or Live Feed (screenshot below). Based on your selection, the data will change to reflect the relevant feed.
Generally speaking, you can think of Dual Feed as referring to commercials which run at a particular time in each respective time zone. For example, an ad that runs at 3pm in Eastern Standard Time and then again at 3pm in Pacific Standard Time.
Again, at a high level, Live Feed refers to commercials which run at the same time across all time zones, no matter the time zone. For example, an ad that runs at 3pm in Eastern Standard Time will also run simultaneously at 12pm Pacific Standard Time.
If you’d like to learn more about about Feeds, check out this guide by Nielsen.

Selecting the “Has Lift?” filter will populate the bar graph and table with data from the commercials which influenced a lift in conversions.

The table below shows a detailed view of the offline marketing efforts. In this example, it shows TV commercials, the breakdown of tiers, the feed type, timestamp, and if the commercial had lift.
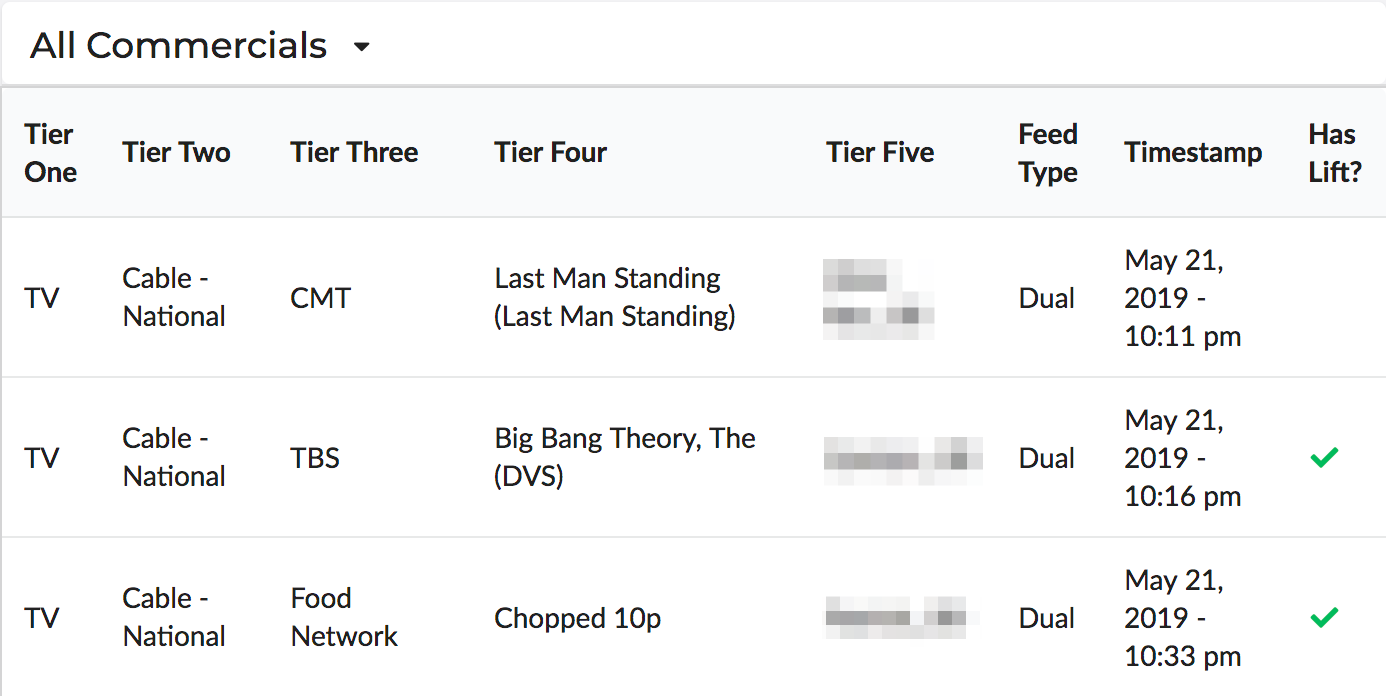
The timestamp displayed for each spot is in your local timezone.
Pro-tip: if you click any of the above commercials, you’ll see a more detailed view of that commercial’s performance in each respective timezone. In the view below, you can expand each row.
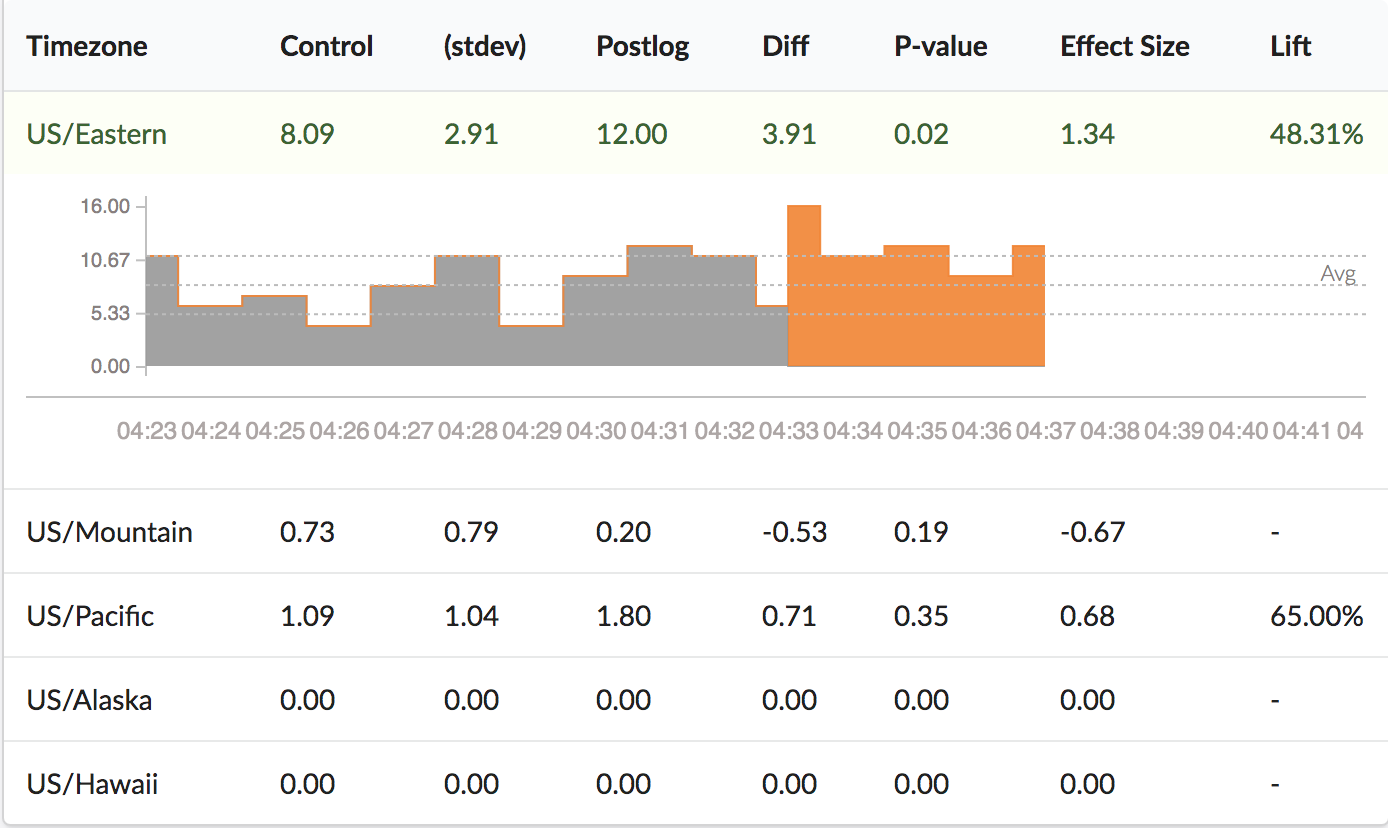
The data in gray are on-site conversions in the 10 minutes leading up to the commercial. The data in orange are on-site conversions in the 5 minutes following the commercial.