Understanding Confidence Intervals & Statistical Significance

Understanding Confidence Intervals & Statistical Significance
One of the most common (and most costly) mistakes in reading incrementality test results is treating statistical significance as a pass/fail verdict. This guide explains what a confidence interval actually tells you, what statistical significance does and doesn't mean, and how to use your results to make better decisions regardless of whether they "pass."
📦 What a Test Actually Produces
When you run an incrementality test, the output is not a single number. The model cannot observe the true incremental effect directly. It estimates it, using observed data and a modeled counterfactual. Because there is always noise in real-world data (from timing, consumer behavior, seasonality, and other factors), the result is expressed as a range of plausible values rather than a single precise answer.
That range is called the confidence interval.
A confidence interval tells you: Given what we observed during this test, the true incremental effect is most plausibly somewhere between X and Y.
The point estimate is the single number reported as the headline iROAS or iCPA. It represents the single most likely value for the true effect and is often at or near the center of the confidence interval.
🔔 The Shape of the Interval Matters
A confidence interval is not a flat range where every value is equally probable. It is shaped like a bell curve: the point estimate at the center is the most likely value, and probability falls off as you move toward the edges.
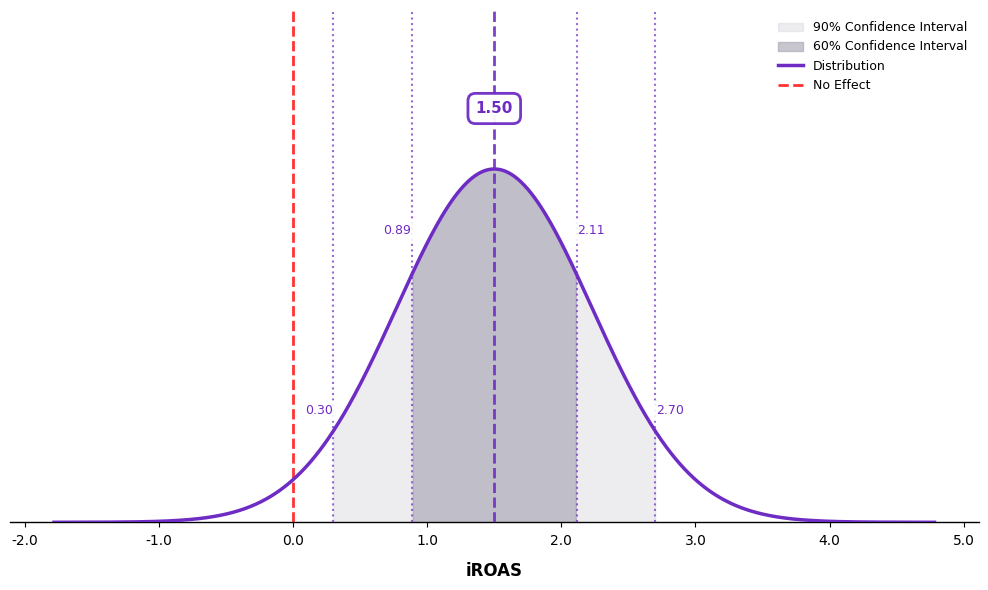
If your test produced an iROAS point estimate of 1.5 with a 90% confidence interval of 0.3 to 2.7:
- The most likely answer is 1.5
- An iROAS of 0.3 or 2.7 is possible, but much less probable than values near the center
- The probability that the result is between 1.2 and 1.8 is 37.6%
- The probability that the result is between 0 and 0.6 is 6.4%
- The edges mark what is plausible, not what is probable
This has an important implication: you should not read the lower bound as the "real" result any more than the upper bound. The honest read is that the data is pointing toward the center, with some uncertainty on either side.
✅ What Statistical Significance Actually Means
Statistical significance is a single property of the confidence interval. A result is statistically significant when the entire confidence interval is above zero.
That's it. It means: the data is inconsistent with no effect at the specified confidence threshold.
What statistical significance does not mean:
- ❌ That the point estimate is the true effect
- ❌ That a non-significant result means the channel doesn't work
- ❌ That a significant result means the channel is worth whatever you spent
By itself, statistical significance tells you the test showed lift above zero. It does not tell you how much lift. The point estimate is the most likely result and is the same whether or not the result cleared the significance threshold.
⚠️ What Non-Significance Does and Doesn't Mean
A confidence interval that includes zero is not the same as a confidence interval centered at zero.
Consider two non-significant results:
Point Estimate | 80% CI | |
Result A | 0.1x iROAS | -0.3 to 0.5 |
Result B | 1.8x iROAS | -0.2 to 3.8 |
Neither result is statistically significant because both intervals include zero. But they tell completely different stories:
- Result A: The distribution is clustered near zero. Even the most optimistic read of this data suggests the channel is barely moving the needle. This looks like a channel that is not working.
- Result B: The distribution is centered well above zero. The most likely answer is a healthy iROAS of 1.8. The interval is wide because there isn't enough data to be certain, but the data is still telling you something meaningful. This looks like a channel that probably works, but you may want to confirm the result with MMM or MTA results.
Treating both results the same (as "no result") throws away information. A non-significant result with a high point estimate is a different finding from a non-significant result with a point estimate near zero.
How to Read Your Results
Rather than asking "did we hit significance?", ask these questions in sequence:
1. Where is the point estimate? This is your best guess at the true effect. Is the iROAS above or below your target? What is the probability that the iROAS is above the target? Above or below breakeven? The point estimate is the most likely answer.
2. How wide is the interval? A narrow interval means the data is giving you a precise answer. A wide interval means there is more uncertainty. The true effect could be materially different from the point estimate.
3. Does the interval include zero?
- If no: the result is statistically significant. The data is inconsistent with no effect.
- If yes: the data cannot rule out zero. But check the point estimate and the width because they tell you whether this looks like "probably no effect" or "probably a real effect we couldn't fully confirm."
4. What does the interval's shape tell you? Remember the bell curve: the point estimate is the most probable value. Even when the interval includes zero, a point estimate well above zero means the data is saying "we think this is probably positive, but we can't fully rule out zero." That is a different message from a point estimate at zero, and it should lead to a different decision.
📋 Every Result Maps to an Action
Once you stop reading test results as pass/fail, every result has a next step:
The interval is entirely above zero. The media is driving measurable lift. Look at the magnitude and ask if the iROAS or iCPA is good enough to justify the spend level. Statistical significance tells you the effect is real. Material significance tells you whether it matters. If the point estimate is above your target, spend in the channel should be increased.
The interval is tight and centered near zero. The media, as deployed in this test, is not driving meaningful lift. This doesn't mean the channel can never work, but at this spend level, with this creative and targeting, it isn't. That is a finding worth acting on. Reallocate or fundamentally change the strategy before retesting, or reduce spend on the channel.
The interval is wide and includes both zero and meaningfully positive values. There may be a real effect, but you don't have enough data to confirm it. Consider retesting with a larger budget, a longer flight, or a bigger holdout. Or triangulate with MMM and MTA to build a fuller picture to inform the best course of action.
The interval is wide and the point estimate is near zero. The channel may not be working, or the test lacked the power to detect a real effect. Before concluding, determine why the interval was wide. If the interval is wide because of external noise like a sale, a promotion, or unusual seasonality, it’s possible that the same test in a cleaner period would produce a tighter result. If the MDE was too high, a more powerful test design with a longer flight, a larger holdout, or a higher-spend cell is needed before drawing conclusions about the channel.
💡 Key Takeaways
The confidence interval is the result. The point estimate is your best estimate of the true effect. Statistical significance is one property of that interval
- Statistical significance tells you the test showed lift above zero. It does not validate the point estimate, the point estimate is the same number regardless of significance
- A non-significant result with a high point estimate is not the same as a non-significant result with a point estimate near zero. They call for different decisions
- The edges of the confidence interval are the boundaries of what is plausible, not equally probable alternatives. The center is the most likely answer
- Every well-designed test produces an insight. The only way to get no value from a test result is to treat it as a binary pass/fail and ignore what the interval is actually telling you
For questions about how to interpret your specific test results, reach out to your Rockerbox Professional Services contact.